Jan. 2, 2019
The Unpredictable Bus
Exploring the challenge of transit reliability from a mathematical modelling perspective.
Somewhere in the world, a bus is late.
It's probably also safe to say that one is early. Somewhere, someone is standing in the cold or the heat, checking their phone or their watch. Maybe someone is tweeting angrily at their local transit agency.
Reliability is incredibly important to both passengers and operators. Late and early buses cause missed transfers and appointments, and lead to overtime and added stress on drivers. Studies put it at or near the top of what people want from their transit system.
And yet, keeping a bus on time is hard. There are constant random interactions with traffic and traffic lights, stops can be busy at some times and empty at others, and weather can throw a wrench in any plan.
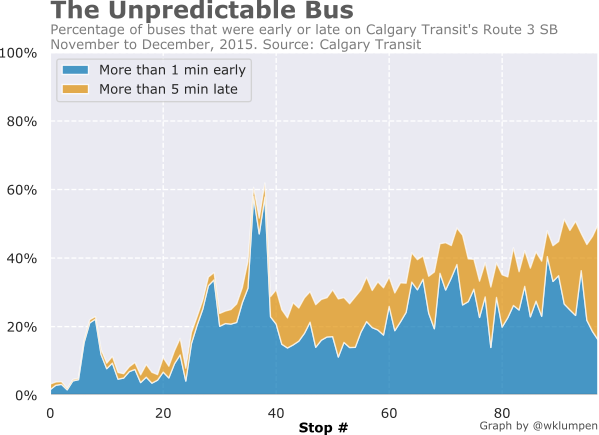
See for yourself. Here is data from Calgary's busiest bus route, showing early and late buses stacked on top of each other. Remember this chart for later, we'll use it when we develop our model.
On top of that, when a transit agency publishes a schedule, they are making a promise. They are promising riders that a certain bus will be in an exact place at an exact time months in advance. That's quite a promise to keep.
So what can we do? One of the best ways to help buses stay on schedule is to remove these obstacles. Dedicated transit lanes and transitways, giving buses the ability to hold signals green, and separating vehicles from the elements are tried-and-true ways of improving reliability and speed. These require funding and political will to be built, but they are effective.
Fluctuating passenger numbers are more difficult to manage. People vary when and where they want to travel, and often update their travel choices based on what's available. Weather, availability of information, and congestion on the route can affect when people will show up at their stop, and when the bus will pass without stopping.
Make them wait
Where transit infrastructure is impractical or undesired, transit agencies may rely on a strategy known as holding control. The strategy is simple - pick some stops, and make a rule: if a bus is early, it waits until it's on time. Then, build some extra time into the schedule so that buses that are late can "reset" themselves, at least partially.
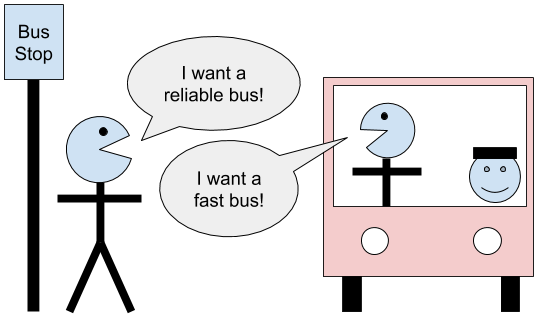
This creates a fundamental trade-off between reliability and speed. Hold more buses at more stops, and the route becomes more reliable, but they also spend more time sitting at stops instead of moving between them.
For passengers, this creates a conflict; a waiting passenger wants a perfectly on-time bus while a riding passenger wants no stopping or waiting until their destination. This internal conflict creates an opportunity for finding the perfect compromise: How much control is the right amount?
If it's good enough for my thesis presentation, it's good enough for my website.
Building a mathematical laboratory
We can't just go out and adjust bus routes and measure the effects. For one, tweaking schedules requires months of notice and planning. It would require long-term data collection. Figuring out the right combination of bus stops and schedules requires making many tiny adjustments, something that is just impractical in the real world.
What we need is to something that captures the essence of what's going on, but removes as much of the outside, noisy world as possible. We need something we can experiment with. We need a laboratory.
So let's get to work.
We'll start by embracing the fact that no matter what we do, the system we are dealing with is going to be random. Mathematically, this puts us in the territory of stochastic processes, a branch of mathematics that deals with random things that change over time. Stochastic processes appear all over the world, from the random movement of pollen particles on the surface of a liquid to stock market prices to presenting Twitter recommendations. So why not make our bus one?
Andrey Markov
Now, we introduce some math. Suppose we sat on a bus with a schedule in one hand and a clock in another. Every time the bus stops at or passes by a stop, we compare our watch with the schedule and write down the difference. 2 for two minutes late, -1 for one minute early, 0 for on time, and so on. Over the course of the entire route, we might get something like this:
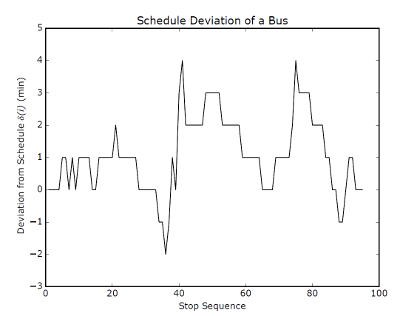
Trajectory of a run of Calgary Transit's Route 3 on a fall day in 2015.
Each time you ride the bus, this "trajectory" will look a little bit different. Sometimes, the bus will be late at a stop when the day before it was early. In some places, the bus will be more consistent. If we look at each stop along the route across a large number of days, we can start to make some predictions of what the bus is likely to do, though we are accepting that we cannot know for sure.
The goal is to not to predict what each bus is going to do at each stop. Instead, we will say something about the underlying probability that governs a bus' behaviour at each stop.
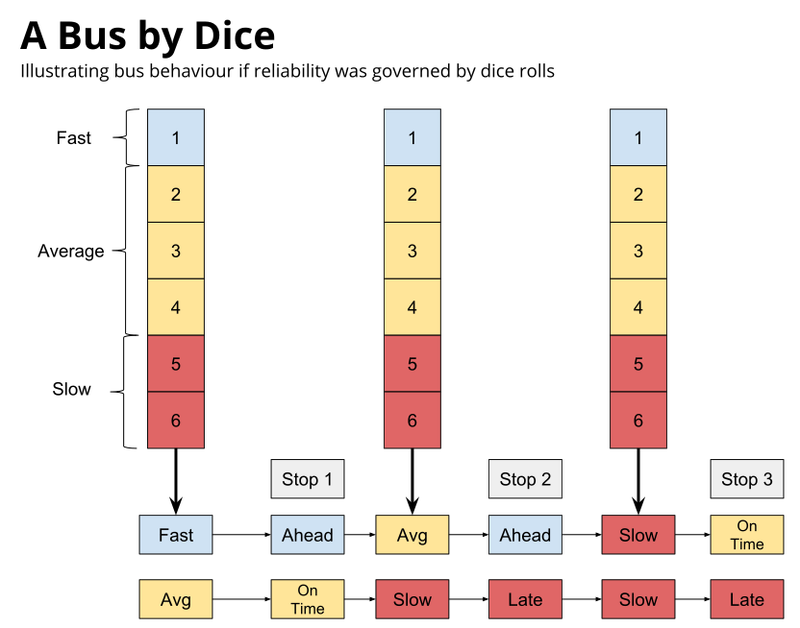
Here's a simplified example: Imagine that every time a bus arrived at a stop, we rolled a six-sided dice. Depending on the roll, the following happens:
1: The bus runs faster than normal. If it was early it stays early, if it was on time it becomes early, and if it was late it becomes on time.
2, 3, or 4: The bus runs at normal speed. An early bus stays early, an on time bus stays on time, and a late bus stays late.
5 or 6: The bus runs slower than normal. An early bus becomes on time, an on time bus becomes late, and a late bus stays late.
In reality, a bus isn't just early, late, or on time. To make things a little more realistic, we can do the same thing we just did with the dice, but perhaps this time we use a 100-sided dice. In this case, instead of "early", we can specify the exact number of minutes early, just as we did when we rode the bus a few paragraphs ago. We can also say that each stop has a dice that's weighted differently, with more numbers likely to come up.
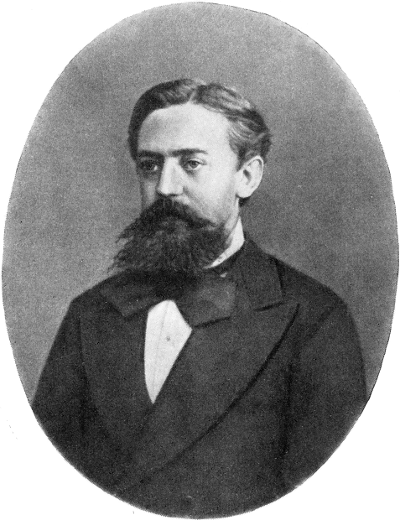
And just like that, we have a model. We have a mathematical description of a real life phenomenon, one that we can adjust and play with as we wish. For example, crating a time point means adjusting the dice roll so that any early bus automatically becomes on time. Since the result of a roll at stop 2 affects the bus as it rolls for stop 3, we have "chained" together these random rolls to describe how the randomness evolves along the bus route. Our friend Andre Markov developed the mathematics to describe this, and so we call them Markov chains.
Now that we have our laboratory, the rest of the work is setting up our experiment. In order to figure out how to weight all these individual dice at individual stops, we need some data from actual buses. With that, we can "teach" our model using this real world data, and then experiment with changes. After a year's worth of assembling our laboratory and calibrating our instrument, we are finally ready to experiment.
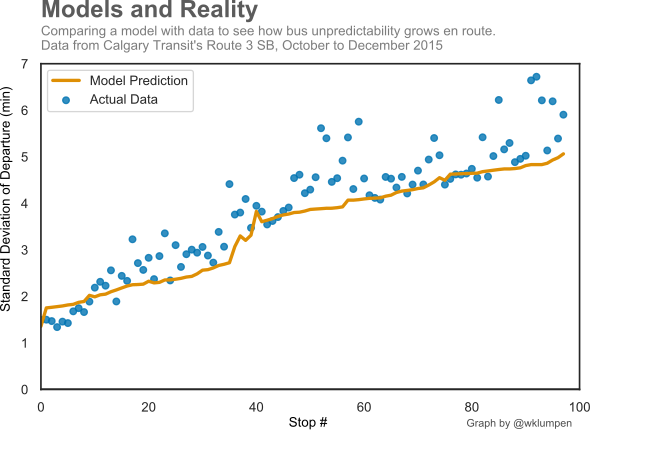
A Useful Tool
The great thing about what we have built is that it allows us to explore many different ideas and phenomena, and it works on any bus, rail, or other transit system in the world, provided that you have the data to teach it. In my thesis, I used it to optimize the placement of holding points in order to find the best trade-off between reliability and speed. I also used it to simulate buses running one after the other, and to examine how changes in the schedule can affect the phenomenon of bus bunching. It can also be used to identify specific areas of unreliability along a route and demonstrate the need for bus lanes or dedicated rights of way.
Sometimes, unpredictability is an uncontrollable thing. That doesn't mean we can't improve.